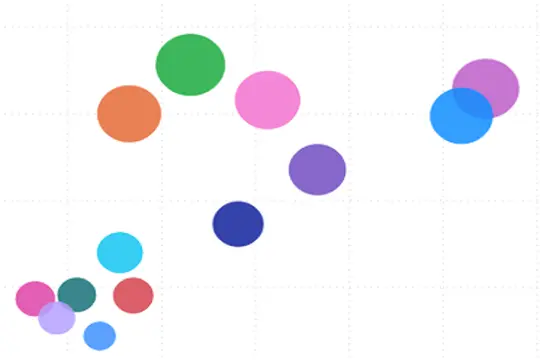
Creating Scatter Chart in Power BI Posted by Chandraish Sinha Categories Power BI Comments 0 comment Creating Scatter Chart in Power BI Scatter chart in Power BI is used to display the relationship between two measures. To create a scatter chart, you place measures of X-axis and Y-Axis. It uses bubbles/circles or any other available shapes … Read More