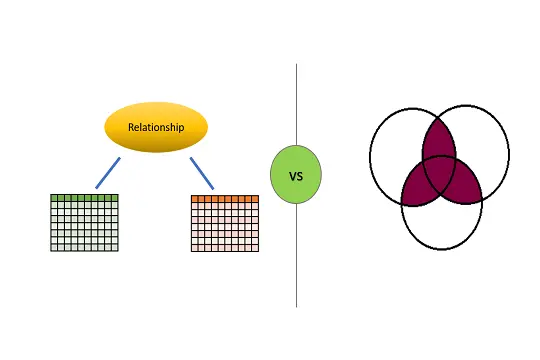
In this blog, we will study the difference between Tableau Relationships and joins
In this blog, we will study the difference between Tableau Relationships and joins

Change values in a filter based on Parameter selection in Tableau Parameters provide good functionality in Tableau and help in creating interactive dashboards. In this article, we will learn how to change values in a filter, based on Parameter selection …
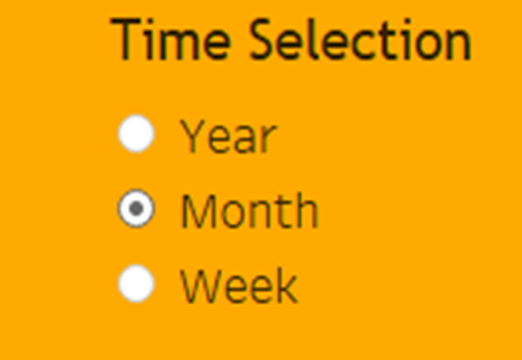
How display a Tableau dashboard for different Time Periods
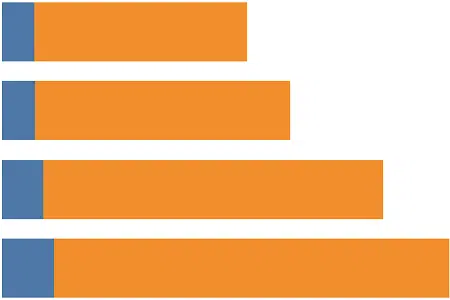
In this blog, I want to discuss how to create a Stacked bar chart with two measures and totals of the stack at the end. In my earlier blog, I showed how to display total on a stacked bar chart …

Fixing User Specific View Thumbnail in Tableau In Tableau, when user filter is used to implement security and the visualization is published on the Server, it displays “User Specific View” instead of the actual thumbnail for views. In this article, …
How to display No Data Found in Tableau In Tableau dashboards, when data is not produced for the selected filters, it displays a blank page. Tableau does not have any default functionality to display a custom message when there is …

Which Country celebrates New Years the First COVID-19 definitely made 2020 a year to remember. 2020 was challenging but New Year 2021 brings hope and happiness. Countries all around the world are welcoming the New Year in a bid to …

How to reset filters in Tableau Filters are a good way to restrict the data displayed on a Tableau dashboard or to view the data, based on the filters selected. But if the number of filters are a lot, it …
Add Apply button to your Tableau filters to provide better user experience.
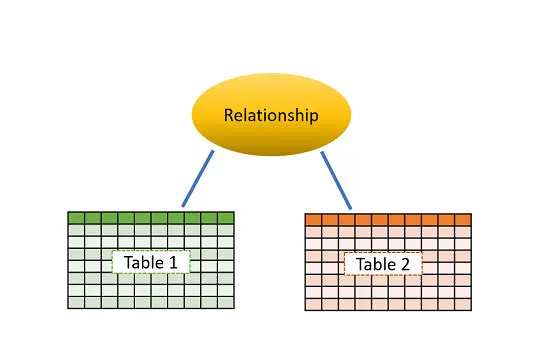
How to create relationships in Tableau Relationships in Tableau are a new, easy and intuitive way to combine data from multiple tables from different data sources. Relationship is NOT a join or data blending. Let’s have a brief overview …