Creating Tableau Stacked Bar Chart with Percent of Total and Totals on Top A Stacked bar chart is easy to create in Tableau but displaying totals at the top of the bars can be tricky. One way to achieve this …
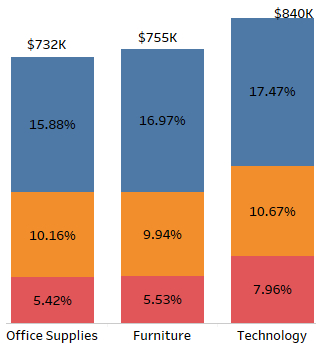
Creating Tableau Stacked Bar Chart with Percent of Total and Totals on Top A Stacked bar chart is easy to create in Tableau but displaying totals at the top of the bars can be tricky. One way to achieve this …
The Cycle field option is available in the Analysis menu and is used to cycle/rotate the dimension or measure fields in a visualization.

Comparing Data merging techniques in Tableau There are various ways to combine or merge data in Tableau. Comparing data merging techniques in Tableau enables analysts to make informed decisions about which method to use in specific scenarios. This blog will …
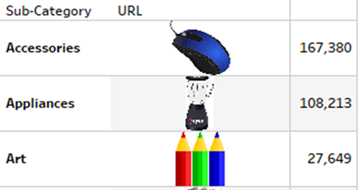
Image role in Tableau This blog will discuss Image role in Tableau. It is a new feature previously released in Tableau 2022.4 and later made available in Tableau server 2023.1. Image role is used to add web images dynamically in …
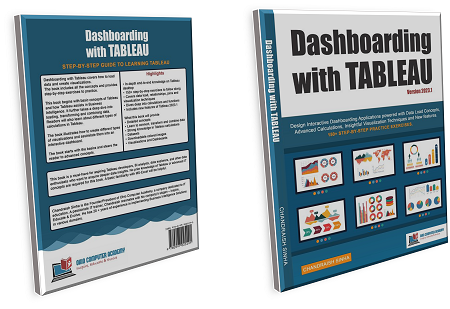
Tableau Book – Dashboarding with Tableau Check out the latest book on Tableau – Dashboarding with Tableau. A comprehensive book with ample exercises. Covers the enhanced features and functionalities of the newest version of Tableau – 2023.1. Find the preview …

Businesses always try to find an edge in their decision-making. In the modern era, emphasis on data is crucial. Evaluating raw data is time-consuming and hence ineffective. Today, business intelligence solutions are needed that must process vast amounts of data …
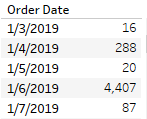
Perform calculations based on a specific date in Tableau In this blog, we will learn how to perform calculations based on a specific date in Tableau. Business requirement: Find the Sales that occurred on 1/3/2019. To explain this concept, we …
Learning Path: An All-inclusive Guide to Mastering Tableau! Tableau software helps you make Big Data small and small data insightful and actionable. Every day in our professional life, we deal with a lot of data. Sometimes this data can be …
How to create path lines on a Map in Tableau In Tableau, we can draw a line between two points, to display distances between them. In this blog we will see how to create path lines on a Map in …

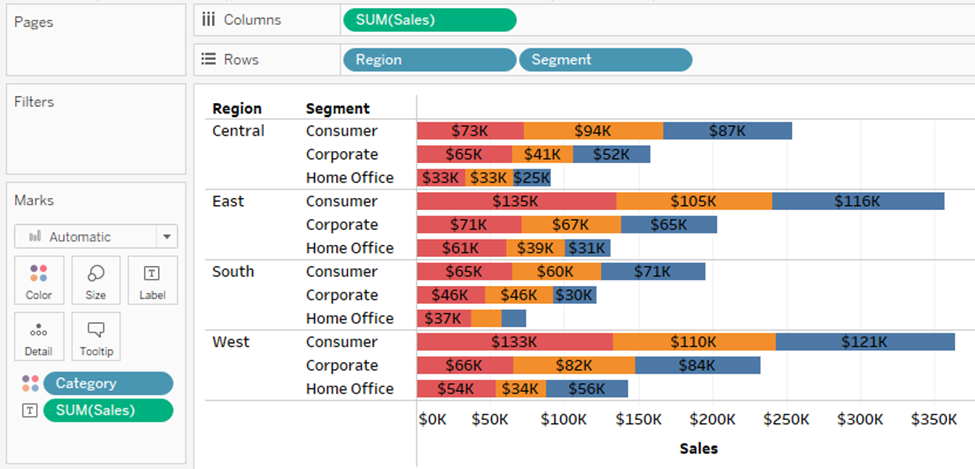
How to Create Totals in Tableau Aggregations or Totals are important in any Visualization application. In Tableau, it is easy to display totals in your charts. There are many variations to creating Totals and Subtotals. In this article, we will …