TechCred assists Ohioans to learn new skills and helps employers create a stronger workforce with much needed skills in a technology-infused economy.

TechCred assists Ohioans to learn new skills and helps employers create a stronger workforce with much needed skills in a technology-infused economy.
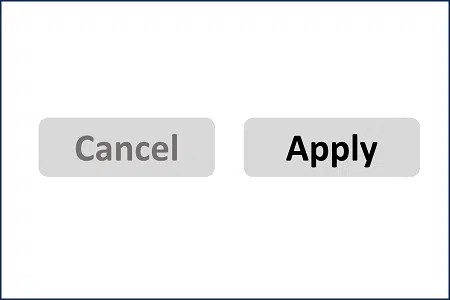
Add Apply button to your Tableau filters to provide better user experience.
Tableau and Microsoft Power BI are both Business Intelligence and data analytics applications.
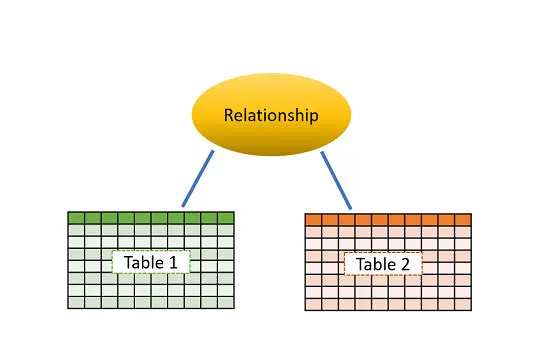
How to create relationships in Tableau Relationships in Tableau are a new, easy and intuitive way to combine data from multiple tables from different data sources. Relationship is NOT a join or data blending. Let’s have a brief overview …

This blog will provide you with information on how to Learn Qlik View and Qlik Sense.
Tableau Tableau is a visualization application that help organizations in understanding their data. Tableau connects to a variety of data sources and help users in creating visualization in terms of graphs, tables and Maps. These interactive visualizations help in data discovery. Visit …

8 Steps to build a WordPress Website How to Build a WordPress website in 8 steps Choose a domain and buy it. Buy the Web Hosting. Install WordPress on your computer. Select a WordPress theme. Install the theme. Install Plugins. …

Building a promising career and succeeding in your career is a huge challenge in today’s competitive world. In this blog, we will discuss on how to succeed in our careers. COLLEGE DAYS! NOT JUST FUN DAYS! As we all know, …

Creating Scatter Chart in Power BI Scatter chart in Power BI is used to display the relationship between two measures. To create a scatter chart, you place measures of X-axis and Y-Axis. It uses bubbles/circles or any other available shapes …
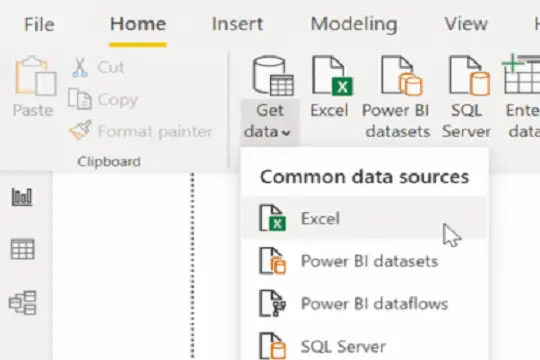
Connect to Excel Data Source in Power BI Microsoft Power BI is a data visualization and Business Intelligence application. It can connect to variety of data sources. In this blog, we will discuss how to Connect to Excel Data Source …